Temporal Changes of the Vegetation Cover
The analysis of vegetation changes in the Shawnigan Watershed used all of the NDVI images from the LandSat data to determine the areal extent of vegetation changes over the 31-year study period (1984-2014).
This data set was then used to carry out two analyses on a pixel-by-pixel basis:
This data set was then used to carry out two analyses on a pixel-by-pixel basis:
- a linear regression of NDVI versus year
- an unsupervised classification
Linear regression of NDVI versus year
|
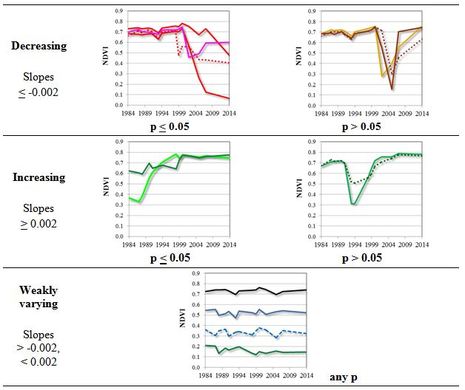
The NDVI-year linear regression analysis generated slope trends for each pixel of the data series which indicates the direction of change (gains or losses) and its significance[1] (p< 0.05). Five classes were created using slope thresholds of + 0.002 and p values. Examples of NDVI trends for each class are shown on the right. [1] the p < 0.05 are statistically significant at the 95% level or better . |
1984-2014 vegetation trends and statistics (derived from the Linear Regression)
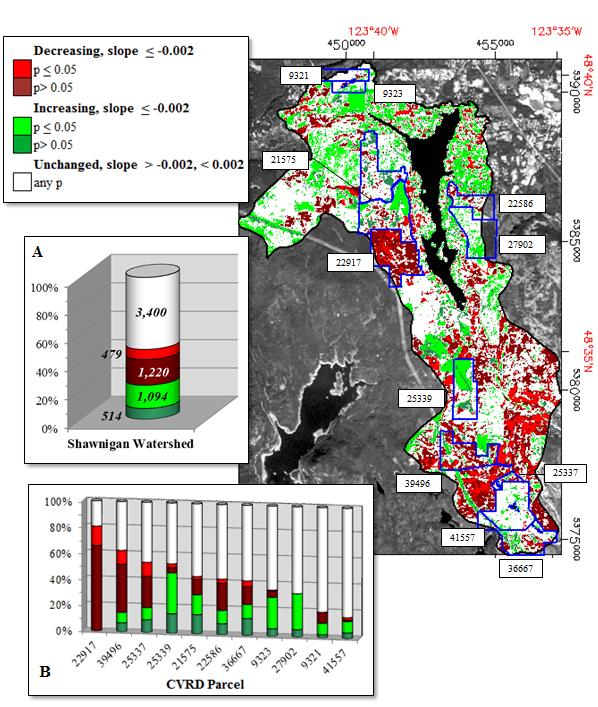
The Shawnigan Watershed trends map was superimposed over the 15 Sep 2014 red band (0.65 μm).
Plots show the distributions and areas (ha) of each trends class for the entire watershed (A) and for each of the CVRD parcels (B), which are presented from the most to the least changed.
The NDVI trends map for the Shawnigan basin shows vegetation losses in 25% of the watershed, most noticeable in the west and south sections. Vegetation gains, observed in 24% of the area, are most evident in the north and some well-defined patches in the southwest. Overall, 51% (3400 ha) of the Shawnigan watershed has experienced little changed since 1984
.
The trend classes varied among the CVRD plots: Nine of the eleven parcels had 46% to 84% of their areas unchanged since 1984, with parcels 41577 and 9321 emerging as the most stable (plot B). Parcels 22197 and 39496 were characterized by vegetation losses, while parcels 25339, 27902 and 9323 showed significant vegetation gains.
It is important to mention that while changes in the slope might not be statistically significant, they are still ecologically meaningful: Steady changes in slope will have p < 0.05, while abrupt slope changes will exhibit p> 0.05.
Abrupt changes are the result of landscape-transforming events, such as those related to logging, agricultural expansion, urbanization, and fire, which alter the spectral properties of the imaged surface (Vogelmann, Xian, Homer, & Tolk, 2012).
One important limitation of the trend analysis is that while decreasing slopes technically represent vegetation losses, as shown in the plots some examples show (regardless of p) a recovery of the vegetation cover with NDVI values close to or above 0.5 in 2014. Another drawback is the ‘weakly varying’ class since it pools NDVI histories with very different thresholds, thus a densely forested area and water are included in the class.
Nonetheless, trends are useful because they provide a synoptic view of long-term changes of the vegetation cover.
Unsupervised Classification
|
Trends analysis does not provide information of when changes happen, or if the vegetation cover shows signs of recovery after a disturbance (characterized by a decreasing slope).
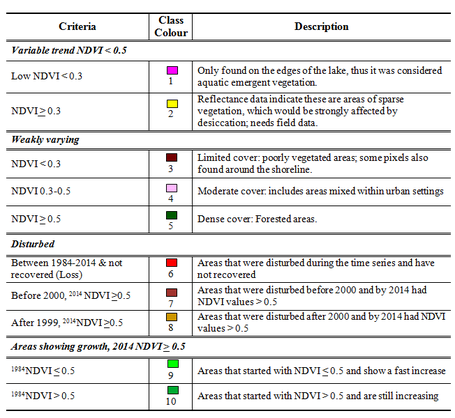
To obtain that information and generate maps of habitat change over the entire watershed a pixel-by-pixel temporal land cover classification was done using the unsupervised algorithm ISODATA in ENVI 5.0TM, which generated seventy groups of pixels with similar NDVI histories. The classification included the watershed uplands only, and excluded the lake Using NDVI thresholds, date of disturbance and other criteria as shown on the Table on the right, more detailed information can be provided on the conditions of the basin’s vegetation and its history. The resulting classification map is shown below. |
Criteria used to group ten vegetation change classes derived from the unsupervised classification of the NDVI time series
|
Temporal Classification Map
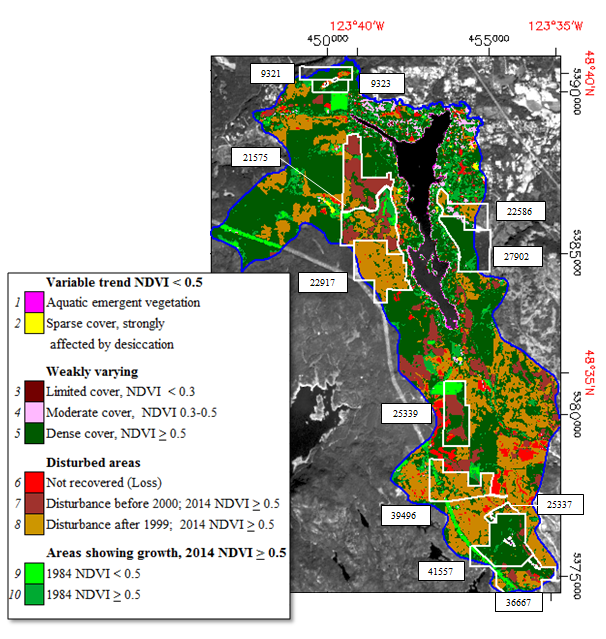
superimposed over the 15 Sep 2014 red band (0.65 μm)
superimposed over the 15 Sep 2014 red band (0.65 μm)
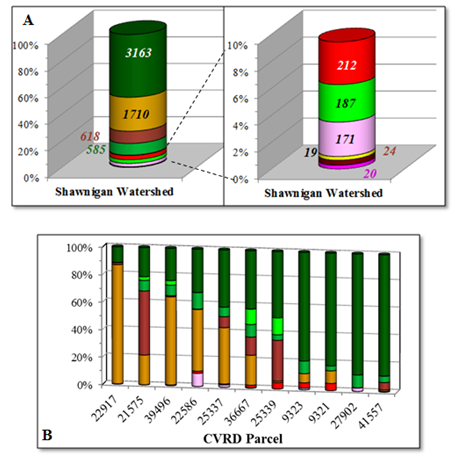
As shown in plot A, the Shawnigan watershed is mostly represented by Class 5, weakly varying dense vegetation cover (47% of the total area), and Class 8, which are areas that were disturbed sometime after 1999 and exhibited regrowth above 0.5 NDVI values by 2014 (25% of the basin).
Areas disturbed before 2000 and recovered by 2014 (Class 7) represented 9% of the uplands and were mostly found in the west sector of the basin
Vegetation loss (Class 6, 3% of the area) was found mostly in the southern section of the basin.
Vegetation growth trends were observed in areas that already had a vegetation cover with NDVI > 0.5 in 1984 (Class 10, 9%), and patches that showed NDVI < 0.5 in 1984, probably due to disturbance, and had NDVI values >0.5 in 2014 (Class 9, 3%).
The moderate cover Class 4 represented approximately 3% of the basin and was found mostly in the northeast, within the urban settings.
The variable and low NDVI Class 5 (0.3% of the entire area) was found in a few isolated patches that are probably disturbed areas covered with sparse vegetation. Aquatic vegetation (Class 1) was found along the shoreline of the lake with NDVI trends consistently below 0.1 values; similarly, the limited cover (Class 3) was mostly found sparsely distributed along the lake. Both classes account for 0.3% and 0.4% of the studied area.
The distribution of the temporal classes varied greatly among the CVRD parcels (plot B). Parcels 9323, 9321, 27902 and 41557 were the most unchanged, showing a dense vegetation cover (Class 5) since 1984 between 79% and 88% of their areas. Other parcels were mostly composed represented by early disturbances and regrowth by 2014 with NDVI>0.5: Class 7 (disturbed before 2000) was most predominant in parcel 21575 (47% of the parcel), and Class 8 (disturbed after 1999) in parcel 22917 (87% of the parcel).
Web Design by VedaWorks and the Shawnigan Basin Society
